Over the winter break I was having a conversation with my cousin concerning the awesomeness of Tableau and all it offers. While Tableau is a best in class product, there are a couple points that he raised which are valid points against the effectiveness of Tableau.
- Tableau uses it’s own proprietary language and functions for a lot of aggregations/advanced functionality that could be done in SQL. SQL based tools are better, he referred to Metabase explicitly among others, due to the fact that most analysts know the language and therefore will easily be able to pick it up.
- Tableau isn’t open source, so as a user, if something doesn’t exist in an open source tool and I know the language, a custom feature to the tool can be added easily (depending upon your ability to code in the respective language).
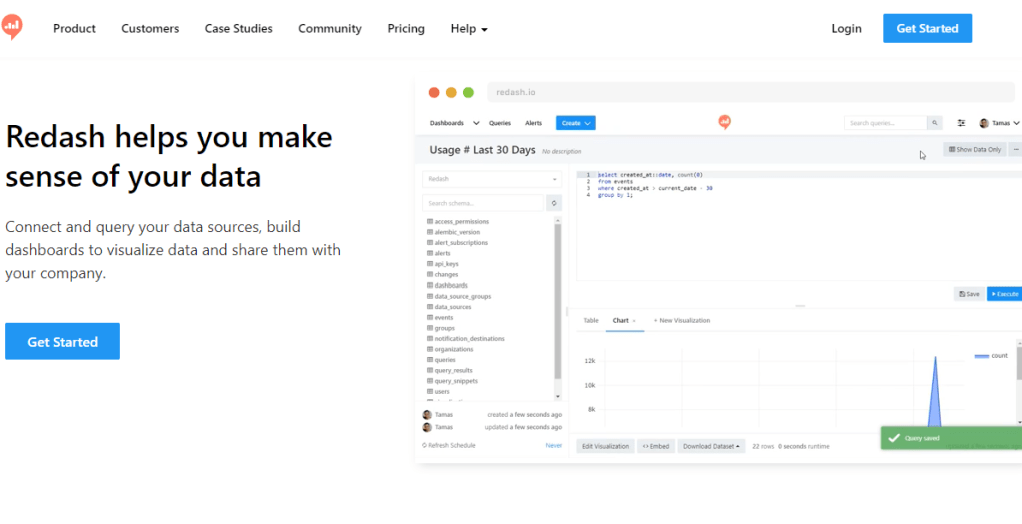
With that in mind, that got me down the path of looking at open source reporting and dash boarding tools that are heavily SQL based. When looking, I cracked upon both a Metabase and Redash instance with which to play around with. Metabase had a good number of features available, but an extremely limited amount of rows which could be ingested by the tool on the free tier.

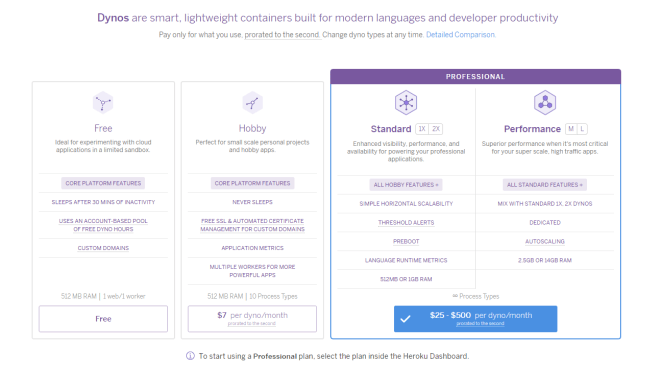
Heroku – Different pricing tiers
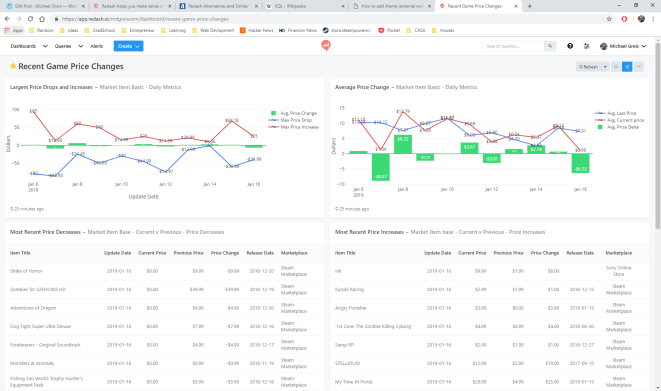
So, not wanting to spend any money upfront, I went over to Redash and started using it to build the first dashboards in the tool using the free trial. Needless to say, I fell in love with the tool instantly then my love was instantly tempered by other limitations present in in Redash. Below is the dashboard that was created, which can no longer be accessed unfortunately due to the free trial period ending, but appeared as pictured below.
Running through the charts, you can see the game and pricing data that has been collected by my scrapers. Scrolling through the different charts you’ll see the following:
- Largest Price Drops and Increases: Shows daily what the maximum price increase has been, and largest decrease has been, along with the average price change for all items which had a price change that day.
- Average Price Change: The average price for items which changed price, along with the average previous price for all items in the Steam Marketplace and Sony Play Store which had a price change for the day. In green is average price change between the old price and new price.
- Most Recent Price Decreases: The last 20 items which have decreased in price, and associated data.
- Most Recent Price Increases: The last 20 items which have increased in price, along with associated data.
At the bottom of each of these panels you’ll see when the data last was refreshed from the database.
Now onto the original reason for writing this article. The pros and cons of using and building dashboards in this tool.
Pros
- No row limit encountered on the free trial! What a great feature. The first requirement I had was that I wanted to be able to ingest a large amount of data and do aggregations using that data. Not having a hard row limit that I ran into with my small 40,000 record data-set originally sold me on this tool.
- Easy to get up and running. Setting up with tool, and making use of the connectors already present in the tool was extremely easy.
- SQL interface is extremely intuitive to anyone who has used SQL Server Management Studio/PgAdmin, or any other database querying GUI tool.
- Refreshes are extremely easy to schedule and reliable.
Cons
- Free trial, and free software if self hosted. If hosted using Redash.io like I did, the price is $49 a month on the lowest tier. Metabase hosting on Heroku is just as easy, and cheaper to use in the long term for small side projects.
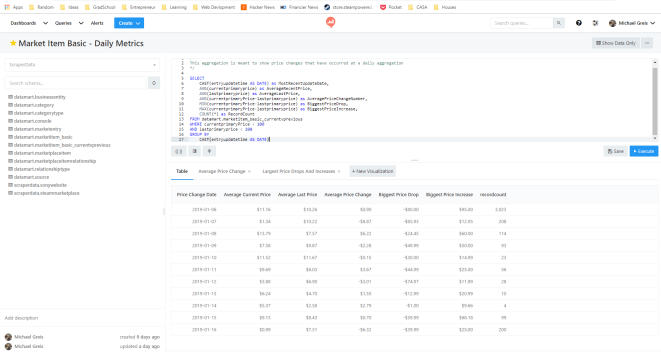
- No aggregations can be done within visualizations, which in my view is a must-have with any dash boarding/reporting tool. Redash forces you to push that logic into SQL code, which results in redundant/complex queries. It also forces you to pre-aggregate, so the feature of “No row limit” in the pro’s section no longer applies.
- Visualization features are basic/limited. Other dash boarding tools allow you do stacked bars, generally more customization option, tool-tips, choosing color schemes, etc. which are not easily available or are limited compared to a tool like Tableau.
Redash was a tool meant for another use case. Perhaps one where you need a basic tool for monitoring ETL, or some other system…Using Redash was a good experience, but using something like Metabase is the tool for me at the moment. Due to the fact that in Redash all calculations have to be pushed down to the SQL and cannot be done with aggregations in the tool, along with the pricing, it doesn’t seem to suit my use case.


