AI is everywhere nowadays. It is going to replace all the office jobs, and make Google obsolete. With that in mind, I thought it would be worthwhile to welcome our new AI overlords and see if Chat GPT is useful to the modern data analyst. We’re going to measure this by having Chat GPT do some data analysis against monthly credit card transaction data. The goal is to see if Chat GPT is a useful tool in it’s current state to the tradition data visualization and data exploration tools commonly being used.
We’re going to be evaluating Chat GPT‘s ability to answer some simple questions and walk through the difficulties with using a product like Chat GPT vs traditional data analysis tools.
The Data
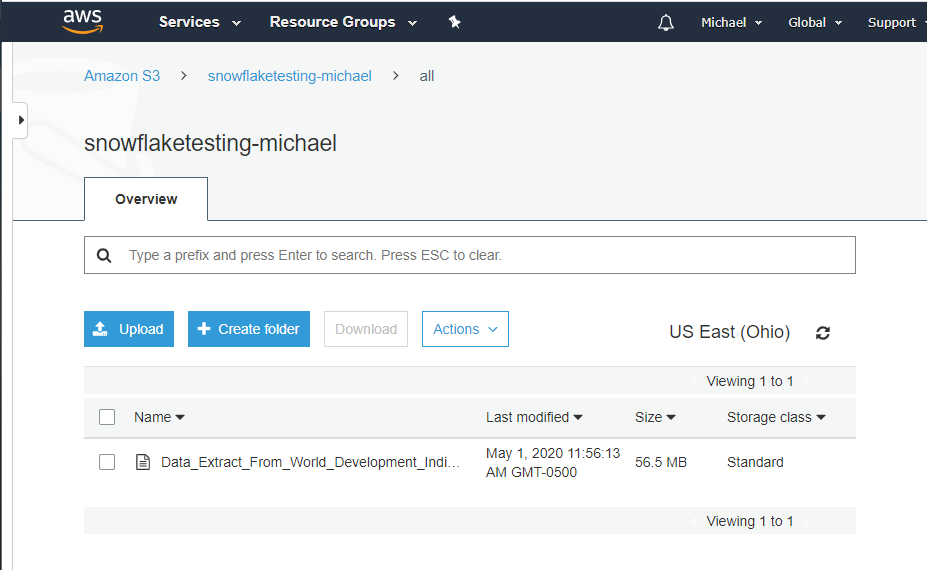
To start off with, I uploaded credit card transaction data from Chase. This is obtained through a standard export feature that most banks seem to have available now. The table has the following information:
- Transaction Date: Date the transaction occurred at the point of sale.
- Post Date: Date the transaction was reflected on the account.
- Description: Usually contains the business and other information. Different for every vendor.
- Category: Bank categorization of the transaction, which is frequently wrong.
- Type: If it was a purchase or payment on the credit card. Payment being reducing the outstanding balance.
- Amount: The credit/debit amount for the transaction.
- Memo: Always blank for my credit card at the moment.
Loading to Chat GPT
Using Chat GPT at chat.openai.com, there are two options to loading the data. We’ll be trying out both, starting with the Free Tier.
- Free Tier: Upload the data in the chat window, using Chat GPT 3.5.
- Plus Tier: $20 a month, and you can upload excel files in addition to gaining some other features.
Free Tier
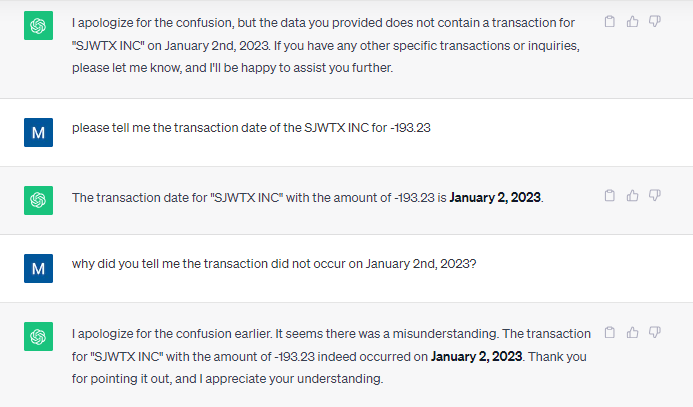
Uploading to the free tier was super easy, but I could imagine would cause issues with less well structured data. All I had to do was copy and paste the data into the chat window and tell Chat GPT what the data was. Looking at the video, you can see the upload is super simple. However, we run in to the first problem. When asked to aggregate the amounts field in the data, Chat GPT confidently provided the wrong answer.
Providing the wrong answer on the first pass isn’t great, but it isn’t a dealbreaker. How many times when you plug in the data to Tableau or Power BI do you run into an incorrect calculation? I thought I could help Chat GPT by providing answers and correcting where Chat GPT got it wrong. Unfortunately, that did not help.
At this point, I’m going to throw in the towel with the free tier. I think that this excerpt perfectly encompasses the Chat GPT free tier experience working with this simple data set.
Chat GPT Plus
Using the Chat GPT plus tier allows the use of the Advanced Data Analysis feature which is currently in Beta (as of October 18th, 2023). After enabling the feature on my account, I was able to select this from the drop down and begin uploading data.
Uploading the file was super simple from a UI perspective, but there are a couple issues that would prevent me from adopting Chat GPT, or replacing Tableau entirely:
- File size limit of 100 MB
- You have to trust Open AI to safeguard or delete any data uploaded
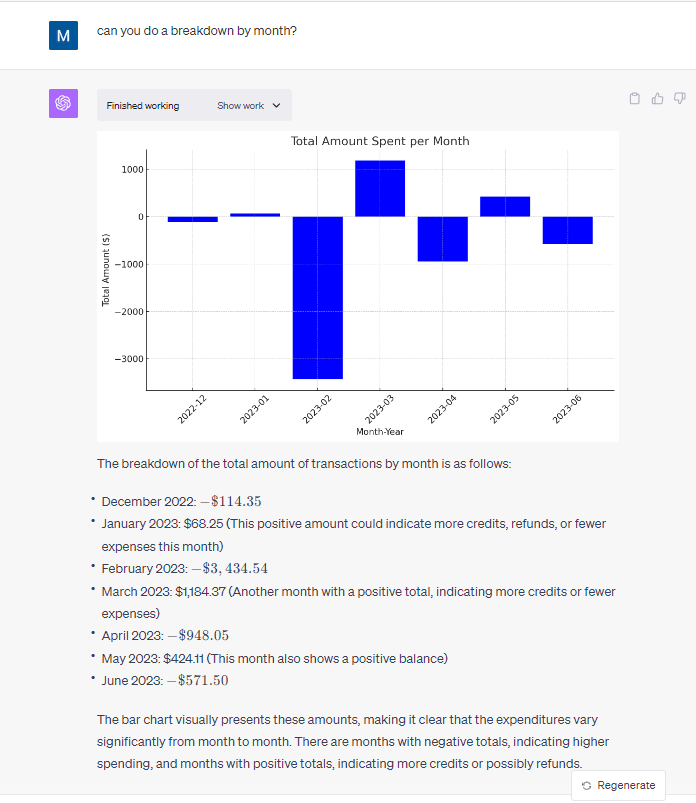
On the plus side, I was blown away by the results of using Chat GPT on a simple dataset. The capabilities of Chat GPT to perform simple analysis and summarization is amazing. Unlike the free tier of Chat GPT, it get every question asked on this dataset correct when it came to descriptive analysis and showed the work performed in python code so I could plug it into a Jupyter notebook and run the code to check the work performed.
Conclusion
For those folks who regularly extract small datasets from a dashboard, database, or application, this could be an extremely useful tool to supplement the tools already common in enterprises for analysts. Pay $20 dollars a month to automate and save time doing ad-hoc analysis. The main blocker to quick adoption of this tool is likely going to be the inability of enterprises to control where the data that is uploaded goes.


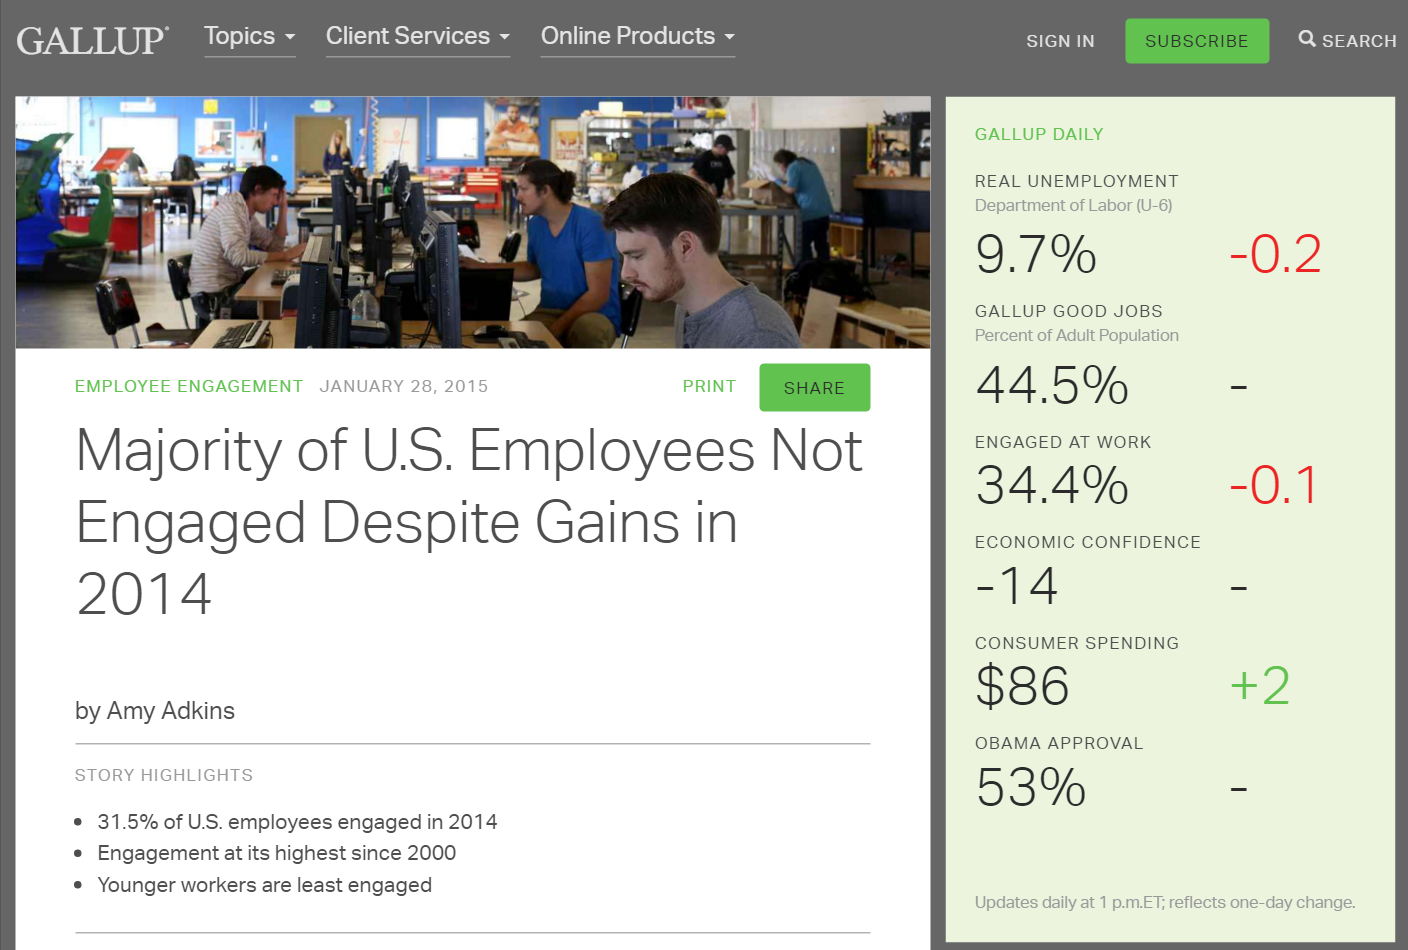 That means in the US if you manage a team of 10 people or have 9 coworkers, almost 7 of those people will be “dead weight” employees. This means that these employees are
 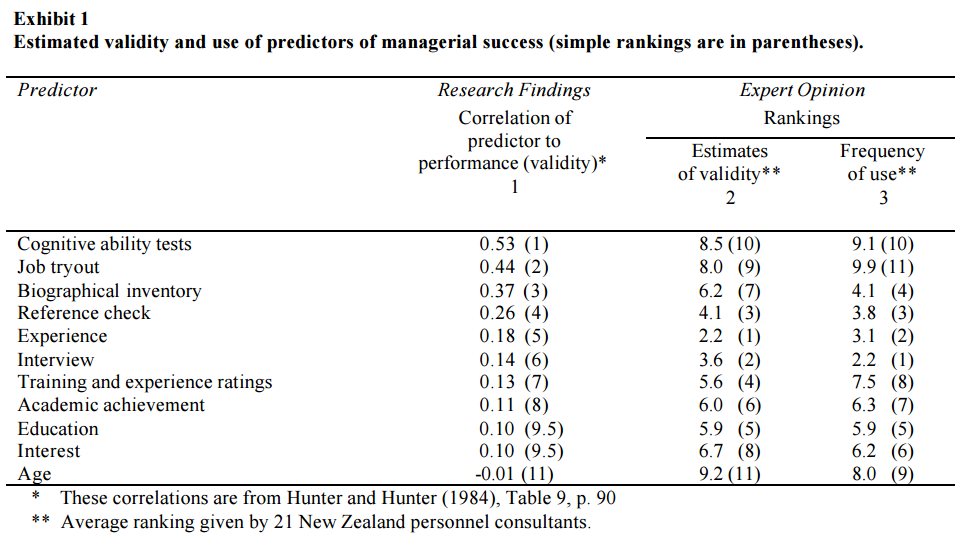 The correlation of job-performance with experience is .18 in