Earlier this month I had the opportunity to attend Data Day Texas, and thought that it would be worthwhile to jot down a few thoughts. For those that aren’t aware of Data Day Texas, think of it as a gathering of nerdy IT people and Data Scientists. It was an interesting weekend with a wide range of topics that encompassed everything from machine learning algorithms to more approachable subjects like data dashboarding.
Graphs Are Here
There’s a reason that the keynote by Emil Eifrem was named “The Year of the Graph”. Looking at the popularity trend on db-engines.com, you can see a large gain in the

Neo4j Popularity
popularity of Neo4j. Leading naturally to the question, so what?
I think the major winning point for graph databases, other than performance on certain types of data analytics, is that graph databases are defined with relationships between data. This is in opposition to the approach of the traditional RDBMS which requires explicitly defining the tables in the schema, with relationships as a non-required afterthought in most cases. This means that while constructing the database, what you are doing is explicitly defining the node (core piece of data) and the edge (relationship between nodes). This means that you are enforcing the relationships between data, as opposed to the structure of the data itself. This creates another level of abstraction between the end user and the data, which should make the data in the database more approachable. Oh, and if you haven’t guessed, graph databases are schema-less which is a plus in many cases.
Issues Are Similiar Across Companies/Technology
In particular, there were two talks that hit this point home. The first was given by Chris LaCava from Expero Inc. in which he discussed visualization techniques with graph databases. The second was the discussion of how Stitch Fix sets up their environment for data scientists to work by Stefan Krawczyk.
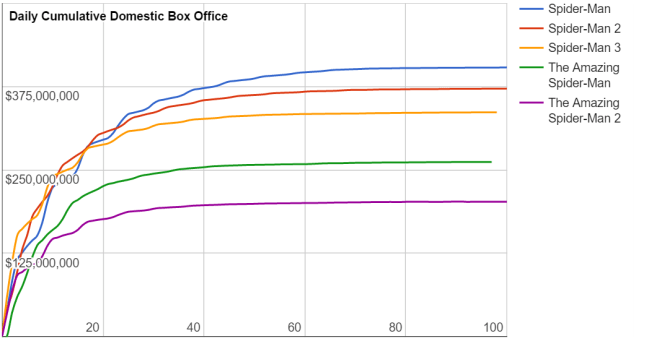
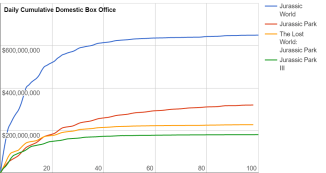
What’s the root of this? People want to use the tools that work and that they like. Chris LaCava discussed how to do visualization on graph databases. While graph databases can

Look familiar? From Chris’ presentation on graph database dashboarding
meet some cool use cases as far as data sets and real time analytics go, what was discussed was a straight forward and common sense approach to dashboarding. Anyone familiar with Business Intelligence and dashboarding should roughly be following the above, or near to it.
Stefan‘s talk was all about using Docker to enable data scientists to use the tools that they want to use. The solution to the complaint that many of us in the industry have when we are locked in with a specific tool-set. The differentiation here was that Stitch Fix has done containerization at scale. This solves that problem by allowing each of their data scientists to run and operate on their own environment, with whatever tool-set they favor to deliver business value.
The Story is What Makes Things Interesting
The final point, which I’ve written about before, is that the story is what makes things interesting. The specific story presented at Data Day? The Panama Papers and how Neo4j was used to discover the unlikely connection that led to the downfall of a Prime Minister. That this was the best marketing tool that I have ever seen in regards to a database.
Having a database GUI that allows for easy exploration of the data natively? That’s a game changer.
Looking at the above, you can see a traditional RDBMS GUI (SQL Server Management Studio) versus Neo4j’s GUI. There’s a reason why people don’t pull up SQL Server Management Studio tools to tell a story. Having a database platform that can automatically tell a story about the data is an awesome approach.


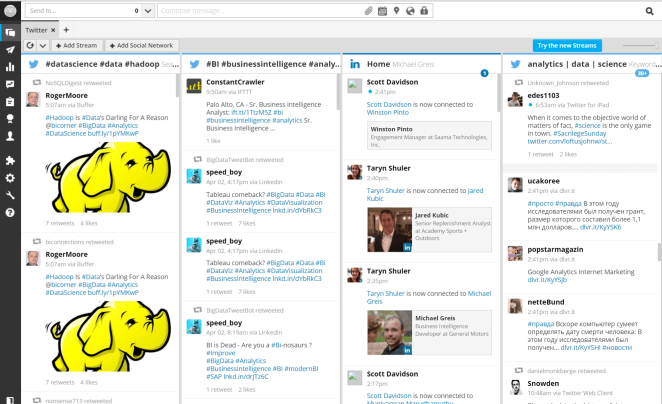 Once the Twitter, LinkedIn, and WordPress accounts have been added to Hootsuite, all the standard streams that would be available on the separate sites are available within Hoosuite, in one page. There is also an extremely useful feature where pre-selected search terms and hashtag streams from Twitter can be added, which saves me time on typing out “data” and “BI” repeatedly. That’s a check on the first use case.