This week, I cracked open Tableau to log into my Amazon RDS instance and noticed that the connection wasn’t working. Logging into the AWS console, my AWS RDS instance had disappeared (along with all the data in it). On perusing my emails, I noticed that I had an unpaid bill in my inbox from Amazon from ~1 month prior. So…along with the instance no longer running, I had lost all data contained which I had been collecting over the past 3 months which is more than slightly disappointing.
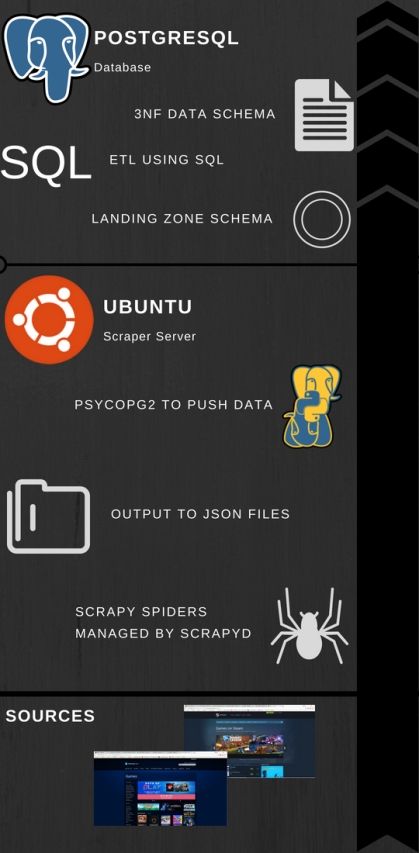
This does present an opportunity though. My EC2 instance is still running, and has been trying to push data to a server that no longer exists, meaning I need to set the RDS instance backup. This was an opportunity to document setting up a new RDS instance on AWS from scratch, with all necessary users, objects, and privileges and document how long it took.
Here’s the process form start to finish;
Start: 4:12 pm
First step, logging in and getting the instance created. You’ll notice during this step that I flip from free-tier to get more storage, then flip back to free-tier. Why pay more money to get increased storage I won’t need for a couple weeks? All I need to do to up the storage is change a configuration which will cause my RDS instance to be down for a couple minutes.
Second step, making sure security privileges are setup. After my first project a couple years ago, and getting my web server destroyed by a script kiddie, I now only open specific ports (which I should have been doing all along).
The third step. I should be able to login to the server using the account that I set up as admin. Once I log in, all I have to do is execute all the create scripts I have.
The way that I created the DDL for my tables and schemas means that I can copy and paste them into query window in PgAdmin4 and execute the scripts. You’ll notice I have a couple semicolon issues that I’ve resolved.
Finally, looks like everything has been created. Just need to validate that my different accounts can login to the server and have appropriate privileges, which they did.
Finish: 5:17 pm

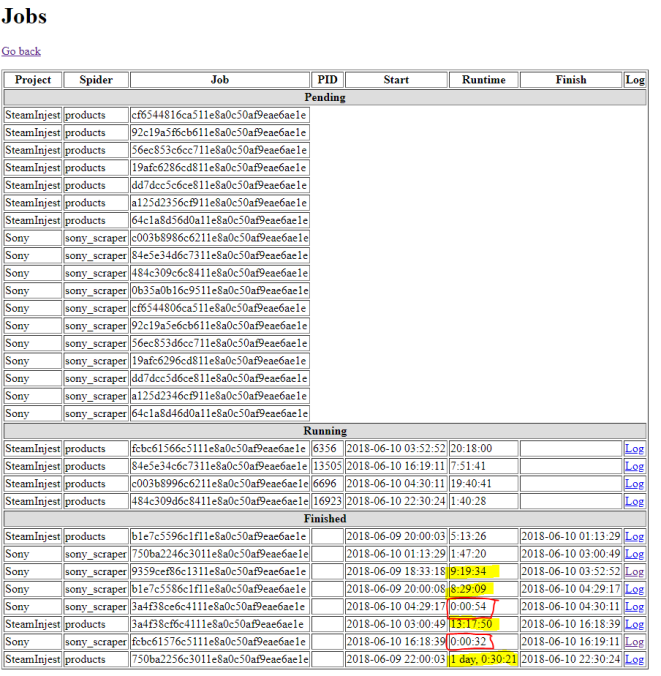
Connections exist from my EC2. With no alteration to any code on the EC2 server!
This process did not include any alteration of the EC2 instance and allowed me to go from a web server scraping the internet and sending files into the ether (nowhere) to having a full database stood up with all objects. This was done in a little over an hour, and ~30 minutes of that was spent executing sql, copy and pasting sql into the query editor for execution, testing to ensure objects/configuration was successful, and fixing minor syntax issues. All of which could be automated away.
I was debating whether or not to get a personal server for my projects, but this in my mind firmly helps cement the cloud as being a better choice when it comes to infrastructure. Comparing to my experience setting up a local SSAS and SQL server instance, this took about 10% of the time and was extremely easy to get running.