Using Redash for Visualization

Over the winter break I was having a conversation with my cousin concerning the awesomeness of Tableau and all it offers. While Tableau is a best in class product, there are a couple points that he raised which are valid points against the effectiveness of Tableau.

  1. Tableau uses it’s own proprietary language and functions for a lot of aggregations/advanced functionality that could be done in SQL. SQL based tools are better, he referred to Metabase explicitly among others, due to the fact that most analysts know the language and therefore will easily be able to pick it up.
  2. Tableau isn’t open source, so as a user, if something doesn’t exist in an open source tool and I know the language, a custom feature to the tool can be added easily (depending upon your ability to code in the respective language).

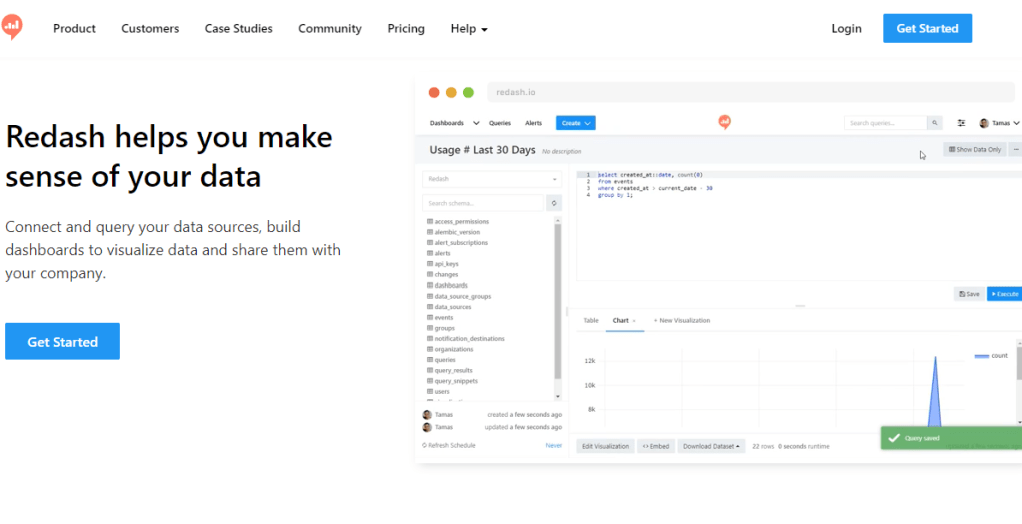
With that in mind, that got me down the path of looking at open source reporting and dash boarding tools that are heavily SQL based. When looking, I cracked upon both a Metabase and Redash instance with which to play around with. Metabase had a good number of features available, but an extremely limited amount of rows which could be ingested by the tool on the free tier.

herokutiers

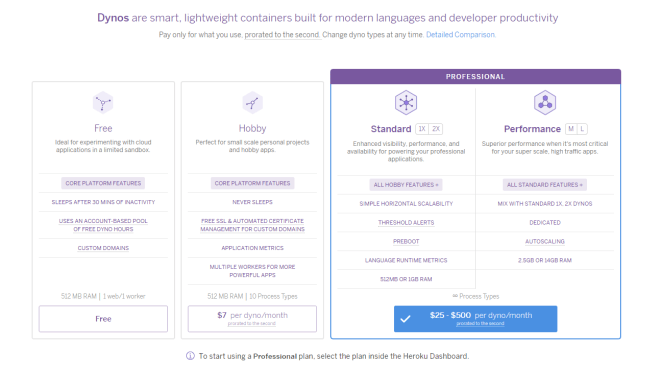
Heroku – Different pricing tiers

So, not wanting to spend any money upfront, I went over to Redash and started using it to build the first dashboards in the tool using the free trial. Needless to say, I fell in love with the tool instantly then my love was instantly tempered by other limitations present in in Redash. Below is the dashboard that was created, which can no longer be accessed unfortunately due to the free trial period ending, but appeared as pictured below.

redash-dashboard

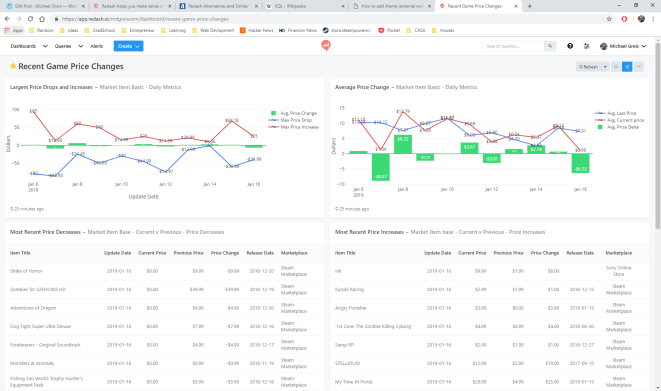
Redash dashboard for Steam and Sony Marketplace price changes

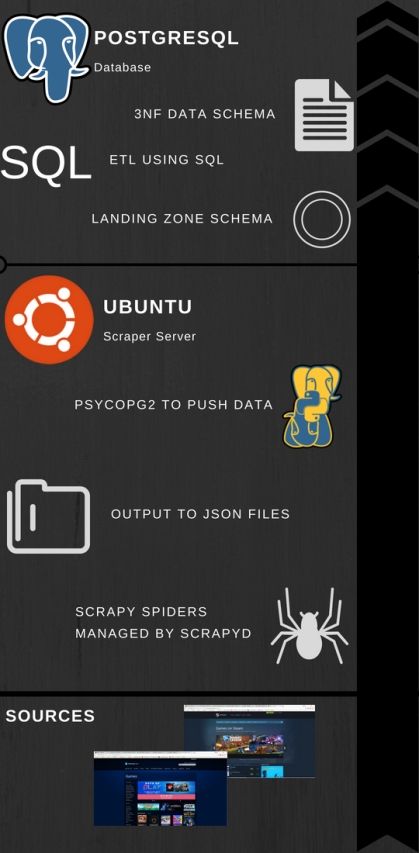
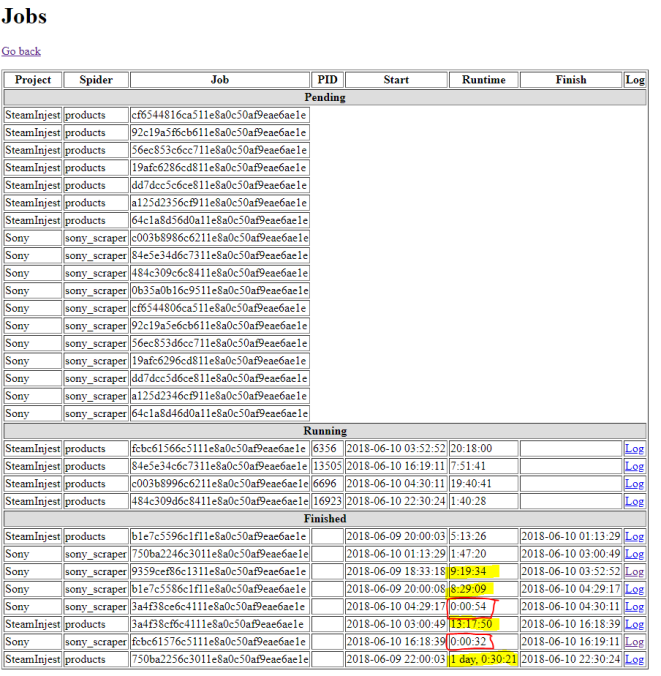
Running through the charts, you can see the game and pricing data that has been collected by my scrapers. Scrolling through the different charts you’ll see the following:

  1. Largest Price Drops and Increases: Shows daily what the maximum price increase has been, and largest decrease has been, along with the average price change for all items which had a price change that day.
  2. Average Price Change: The average price for items which changed price, along with the average previous price for all items in the Steam Marketplace and Sony Play Store which had a price change for the day. In green is average price change between the old price and new price.
  3. Most Recent Price Decreases: The last 20 items which have decreased in price, and associated data.
  4. Most Recent Price Increases: The last 20 items which have increased in price, along with associated data.

At the bottom of each of these panels you’ll see when the data last was refreshed from the database.

Now onto the original reason for writing this article. The pros and cons of using and building dashboards in this tool.

Pros

  1. No row limit encountered on the free trial! What a great feature. The first requirement I had was that I wanted to be able to ingest a large amount of data and do aggregations using that data. Not having a hard row limit that I ran into with my small 40,000 record data-set originally sold me on this tool.
  2. Easy to get up and running. Setting up with tool, and making use of the connectors already present in the tool was extremely easy.
  3. SQL interface is extremely intuitive to anyone who has used SQL Server Management Studio/PgAdmin, or any other database querying GUI tool.
  4. Refreshes are extremely easy to schedule and reliable.

Cons

  1. Free trial, and free software if self hosted. If hosted using Redash.io like I did, the price is $49 a month on the lowest tier. Metabase hosting on Heroku is just as easy, and cheaper to use in the long term for small side projects.
  2. No aggregations can be done within visualizations, which in my view is a must-have with any dash boarding/reporting tool. Redash forces you to push that logic into SQL code, which results in redundant/complex queries. It also forces you to pre-aggregate, so the feature of “No row limit” in the pro’s section no longer applies.
  3. Visualization features are basic/limited. Other dash boarding tools allow you do stacked bars, generally more customization option, tool-tips, choosing color schemes, etc. which are not easily available or are limited compared to a tool like Tableau.
redash-queryeditor

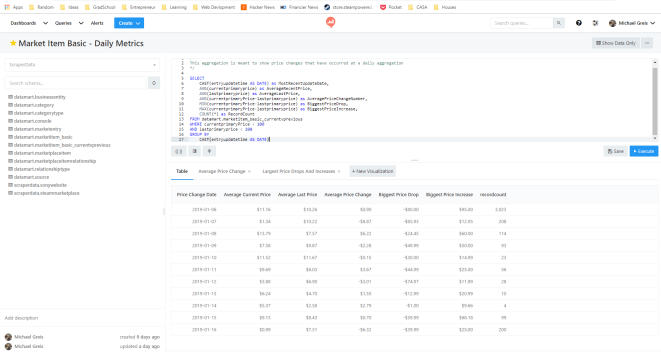
Redash query editor. Combine multiple query visualizations to create a dashboard.

Redash was a tool meant for another use case. Perhaps one where you need a basic tool for monitoring ETL, or some other system…Using Redash was a good experience, but using something like Metabase is the tool for me at the moment. Due to the fact that in Redash all calculations have to be pushed down to the SQL and cannot be done with aggregations in the tool, along with the pricing, it doesn’t seem to suit my use case.

A Foray Into Serious Scraping

It’s been a while since my last post. Getting married, honeymooning, buying a house, etc. took away the time I had for this. But all of that is nearing it’s end, so I’m getting back into the regular cadence of working on the scraping project. Since I’m now back into it, and got everything up and running, I figured the most sensible place to start is the architecture that has been implemented.

The Problem:

The most sensible place to start any discussions of architecture is clearly stating what the system is supposed to do. I need a system that accomplishes these three things.

  1. I need a system that is able to reliably scrape data from any website or consume data from any source.
  2. I need a place where this data can be loaded and reported on in a cohesive format.
  3. I need the product to be lightweight as far as storage space required and CPU so I don’t have to pay out the wazoo.

Overview:

Scraper Architecture

Overview of the architecture, from inputs to database inserts.

In order to meet this, a straightforward architecture was implemented. Using Amazon Web Services both a EC2 instance and RDS instance were set up, with the EC2 being an Ubuntu instance and the RDS being Postgresql. In sequential order, here is how the scraper works.

  1. Using python’s Scrapy library, we’ve written Scrapy projects which look to specific sources to bring in data based upon the HTML on websites. Right now, we’ve targeted two, but can expand to as many as needed. These Scrapy spiders are scheduled through Scrapyd, a framework that no only allows for scheduling and management of spiders, but also offers better performance by operating on Twistd making it asynchronous.
  2. As the spiders are constantly running they are outputting to JSON files on the server. Basically, the driver here is to have a place to drop the output of the data onto the server so that data won’t be lost if something happens with one of the processes.
  3. A Python class was written with Psycopg2 in a way that is meant to be extensible for future data sources. The idea being, that as the data model and data sources are changed/expanded upon, the only thing that will need to change is the class itself. None of the scripts that call the class to insert data from our existing data sources will need to change.
  4. A staging area was created within the RDS PostgreSQL instance which ingests the raw data from the data source. Where possible, a unique index was created that checks for changes before accepting the data into the staging area. As we have scrapers hitting sources repeatedly, we are going to be grabbing the same data. What we’re interested in are the changes, especially in regards to new items or price changes. Also, we want to make as efficient as possible of a architecture so storing only the data we are interested in just makes sense.
  5. Once data has been accepted into the landing zone, the Ubuntu instance is used to schedule a slew of ETL jobs written in SQL and passed to PostgreSQL for execution using Psycopg2. Postgresql doesn’t have a native scheduler readily available, so we use the Crontab functionality of Ubuntu to execute a script for each of our sources that calls from a class containing all of our ETL functions. The end result of this is a 3NF model populated with data and appropriate relationships made.

So, it’s now up and running, and data is flowing through into the objects. The data is populating for all tables where it is expected and I could begin reporting price changes today. The best part? All of this was built using $0’s of infrastructure from Amazon Web Services (and a lot of my time). I’m running out of storage space rapidly (20 gigs from the free tier ran out over a couple days), and the CPU is not beefy at all, so stalls out if more than one scraper is running at a time (as pictured below).

scrapyd-performance

Performance goes down dramatically in yellow. In red, my scraper has been blocked from accessing the site (which didn’t happen before refactor…I’ll go into that another time)

To refer back to the original goal, I would say it has been achieved. Not to say that it couldn’t be improved upon and optimized. But overall, the first serious foray into scraping seems to of gone well. Feel free to reach out with any questions, or suggestions!

Social Media from the Seasoned

history-of-social-mediaHuman history began 4,000 BCE. Social media in its modern form? Started in 1997 with the site Six Degrees. Putting these two timelines together may seem ridiculous, and admittedly is a bit, but there is a point. With social media being such a recent innovation compared to many skills still heavily used and valued by society today, such as accounting, what can social media media professionals teach us about this roughly 20 year old skill set?

I’ve had the opportunity to hear from industry experts from McGarrah Jessee, Splash Media Group LLC, and other both large and small social media marketing firms. These individuals have covered everything from creating useful branded content to establishing client relationships (and more). Although a new field, there is definitely a large group of driven individuals working towards continuously evolving and growing the usefulness of social media for business. I’m going to attempt to encapsulate a few of the important points at an extremely high level.

Biggest Applicable Advice

When interacting with people on a day to day basis, what do you prefer? A person who talks about themselves and what they have accomplished, or people who provide valuable advice and interesting conversation? Well, social media experts have realized that businesses can create a relationships with people that represent the latter through content marketing.

Content marketing seems to be a phrase that all of these social media professionals, across multiple industry and business sizes, have been repeating or hinting at. “Make it interesting” or “Make your content something people want to read”. With the deluge of ads that people see everyday, and the myriad of ways to avoid seeing these adds, advertisers now have to convince people that they want to spend time looking at ads. This same concept can be applied everywhere.

Whenever communicating with others, be genuine, interesting and most importantly create value so that people want to listen. Sticking with these pillars can go a long way.

The days of useless and noisy banner advertising are over.

Attributes of Social Media Professionals

There seem to be two types of primary skills that are needed to be successful at social media marketing. The first, an analytical ability to extrapolate data into stories and actionable items for advertising. What do I mean?

Building profiles of the target customer, measuring what works and what doesn’t, basically collecting every piece of data that is available and having the ability to develop strategies around these data points. Looking at Hops and Grain, a local brewery, the social media strategist has been able to learn from data and create a social media profile and brand that people find interesting and go out of their way to view.

Looking at the below pictures can you see a common theme? Outdoorsy, lifestyle type photos that sneak in the beer and branding into the picture in somewhat subtle ways.

Hops and Grain insta.PNG

The second major attribute I noticed was that all of the individuals, no matter how data driven they are, seem to be creatives. What I mean is that these professionals love coming up with new and clever ideas.

This seems to be needed due to social media being a medium that can produce widely varied results. Content must be instantaneous, in the moment, and clever, or risk becoming a Red Lobster. If a professional can’t come up with new ideas that capture people’s attention, success in social media is unlikely.

Quick Takeaways

  1. At the end of the day, using social media as a microphone doesn’t work.
  2. Be consistent online (and in life)…but really, nothing disappears once it’s online.
  3. Don’t feed the trolls. There are toxic followers, just like their are toxic customers. Be aware of who with and how you’re spending time on social media.

After hearing these different speakers, I don’t have plans to apply these learnings directly on pursuing a career in social media. Luckily these lessons can be applied outside of conducting advertising for a business client. I plan to apply the concepts to my career and developing a personal professional brand.